

Apple Journal App
Design Innovation Fall 2024 - UX Design Academy
Tools Used: Figma, FigJam
Duration: 14 weeks
Journaling has many benefits, however it has been a lost art and people are struggling to find the motivation to journal consistently.
Design Approach
Secondary Research
Competitor Analysis
User Interviews
Personas / How might we
Information Architecture
LoFi / HiFi
As the design lead I had free reign to find any application to redesign, or any problem to solve. I ended up choosing the Apple Journal app because it is a default application that every Apple user has access to, however it is not a commonly used application.
Team:
Role: Team Lead, UX Instructor
Team Members: Brianna Regione, Sebastian Vega, Millie Chu
Overview
For some context, Design Innovation is a UX design organization on the UIUC campus that offers various UX design projects for anyone with an interest in pursuing a career in UX. Within the organization there is an academy program which allows students with no UX experience to explore what it is like to work on a UX project and get familiarized with UX practices.
Our Challenge
My Role
My role was to teach and guide 3 other members to get familiarizes with best UX practices, as well as apply those skills to a re design project.
Incorporating goal tracking capabilities and customizations to incentivize and encourage users to journal more.
Why this?
Our Solution
Secondary Research - Broken Down to 2 Groups
Active Journalers:
Around 8% of people are considered active journalers, meaning they currently keep a journal regularly.
Past Journalers:
Approximately 22% of people have kept a journal at some point in their lives, but no longer do so.
Research suggests that journaling can help us accept rather than judge our mental experiences, resulting in fewer negative emotions in response to stressors
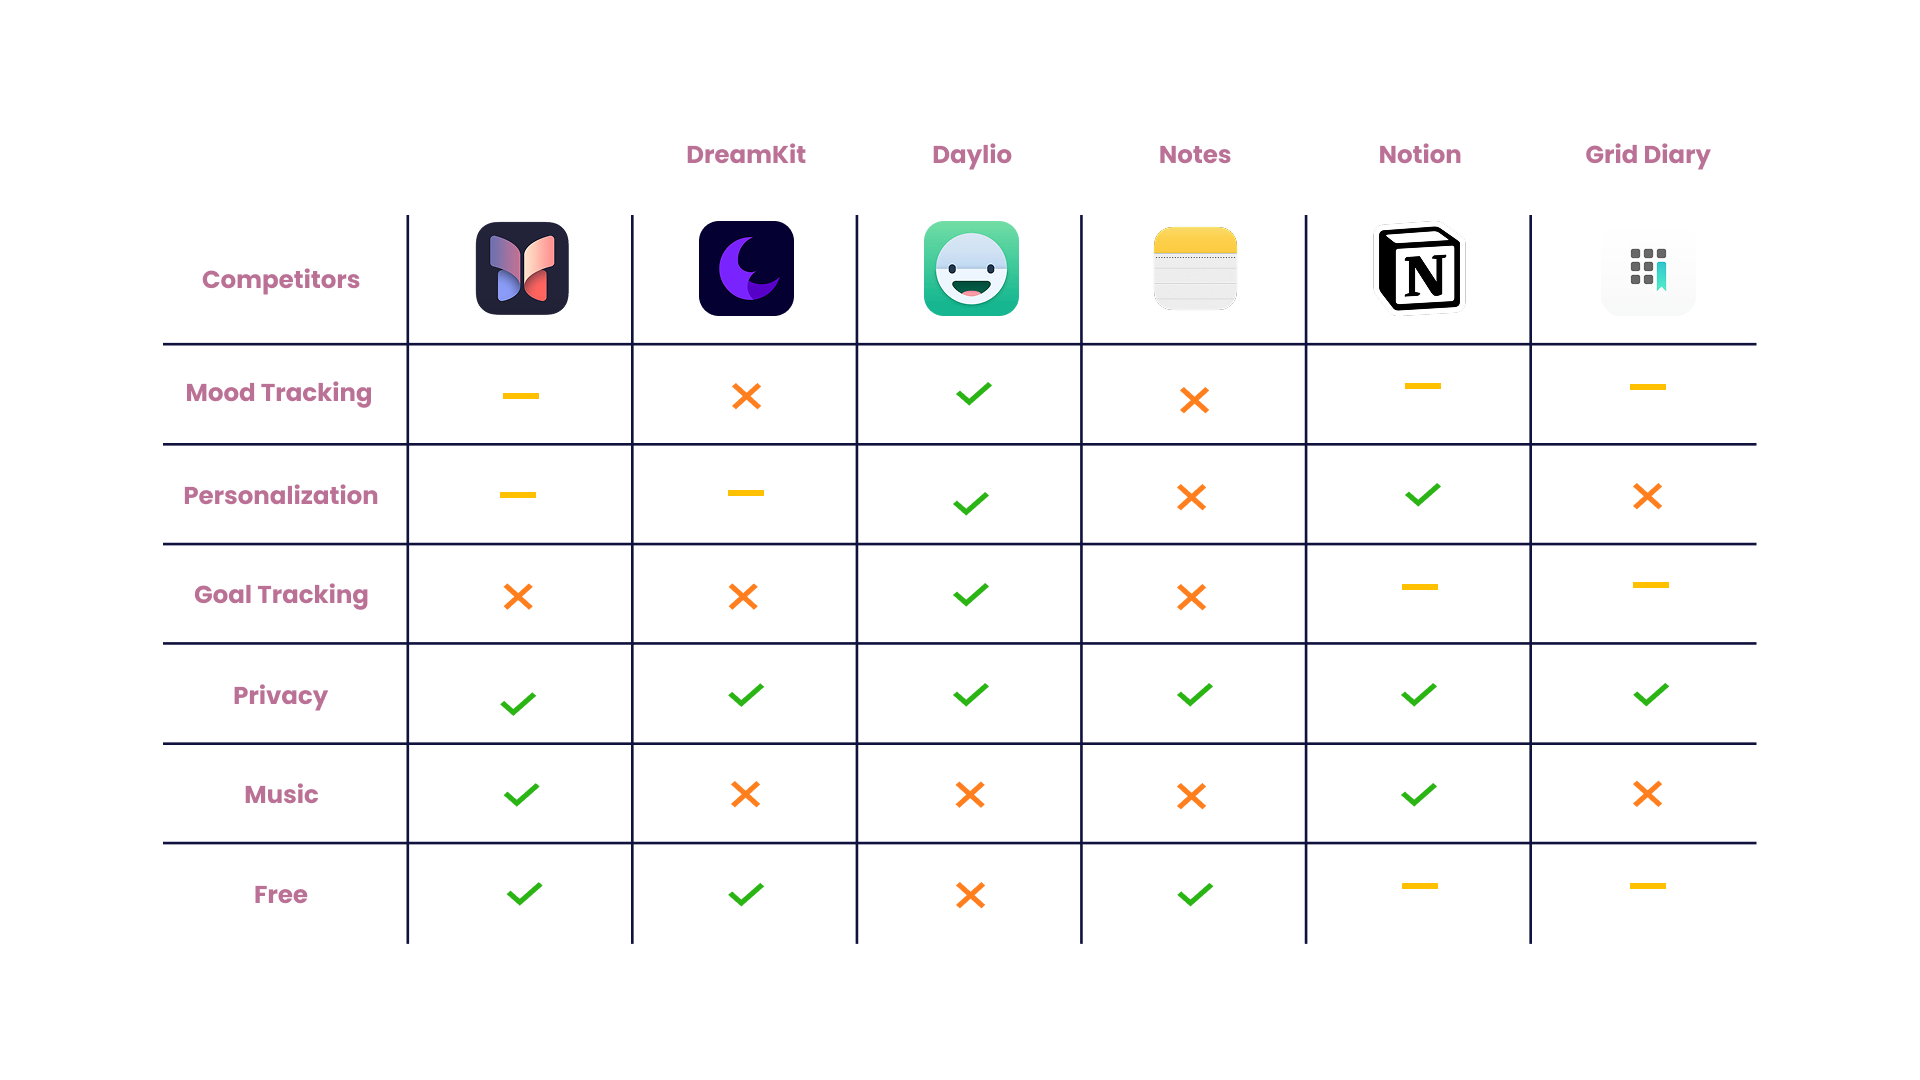
Competitive Analysis
Compared 5 different apps that are either advertised as journaling apps, or produce the same effect related to personalization and tracking.
User Research
We Interviewed 9 different college students to understand their perspective of journaling and what problems they faced with developing it into a sustainable habit.
Summary & Insights
Many people who don’t want to journal is due to it feeling like a chore rather than a calming/fun task/activity.
People who don’t journal feel that it doesn’t fit within their routine or get caught up with the aesthetic aspect.
Many students journal as a way to keep track of their personal goals.
How Might We Questions
How might we incentivize people to start journaling and stay consistent?
How can we motivate users to engage with the app regularly while ensuring they don’t feel overwhelmed?
How might we add more customizable features to make the app more personal?
Developed “How Might We Questions” to better guide our decision making and design process, going back to our core research insights and the problem we are solving for the users at hand.
Information Architecture & Design System


Ideation

We designed widgets to create a more engaging user experience to build retention for the users, as well as a quick action to engage with the app.
We changed the user flow to allow users to immediately take the time to reflect on their mood and what their intentions are with the current state of their journaling process.
